Introduction
The Hough Transform is a method that is used in image processing to detect any shape, if that shape can be represented in mathematical form. It can detect the shape even if it is broken or distorted a little bit . Let’s now understand how Hough transform works for line detection using the HoughLine transform method. As a first step, to apply the Houghline method, an edge detection of the specific image is desirable.
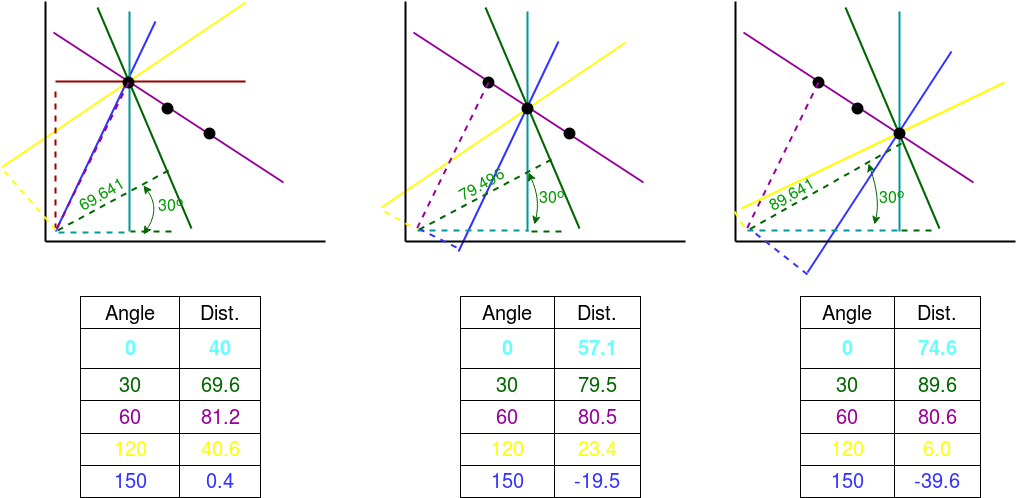
A line can be represented as y = mx + c or in parametric form, as r = xcosθ + ysinθ where r is the perpendicular distance from origin to the line, and θ is the angle formed by this perpendicular line and horizontal axis measured in counter-clockwise ( That direction varies on how you represent the coordinate system. This representation is used in OpenCV). So Any line can be represented in these two terms, (r, θ) as you can see in the image below.

How does Houghline method work
First it creates a 2D array or accumulator (to hold values of two parameters) and it is set to zero initially. Let rows denote the r and columns denote the (θ)theta. Then, size of array depends on the accuracy you need. Suppose you want the accuracy of angles to be 1 degree, you need 180 columns(Maximum degree for a straight line is 180). Also, for r, the maximum distance possible is the diagonal length of the image. So taking one pixel accuracy, number of rows can be diagonal length of the image. Let us understand this better through the example below.
Example
Consider a 100×100 image with a horizontal line at the middle. Take the first point of the line. You know its (x,y) values. Now in the line equation, put the values θ(theta) = 0,1,2,….,180 and check the r you get. For every (r, 0) pair, you increment value by one in the accumulator in its corresponding (r,0) cells. So now in accumulator, the cell (50,90) = 1 along with some other cells. Now take the second point on the line. Do the same as above. Increment the values in the cells corresponding to (r,0) you got. This time, the cell (50,90) = 2. We are actually voting the (r,0) values.
You continue this process for every point on the line. At each point, the cell (50,90) will be incremented or voted up, while other cells may or may not be voted up. This way, at the end, the cell (50,90) will have maximum votes. So if you search the accumulator for maximum votes, you get the value (50,90) which says, there is a line in this image at distance 50 from origin and at angle 90 degrees.

Everything explained above is encapsulated in the OpenCV function, cv2.HoughLines(). It simply returns an array of (r, 0) values. r is measured in pixels and 0 is measured in radians.
OpenCV implements two kind of Hough Line Transforms:
a. The Standard HoughLine Transform – It consists in pretty much what we just explained in the previous section.
b. The Probabilistic HoughLine Transform – A better implementation of the HoughLine Transform
We will now learn how to implement these two types of Transformation through code. If you want to learn more about OpenCV implementation with reference to Image Thresholding, Image Noise Removal, Image Cropping, Image Rotation, Image Annotation and Image Detection then you can learn the implementation with coding exercises at OpenCV Implementation with Coding Examples.
If you want to go deeper into how these models work and are implemented then Coding exercises with live examples can be accessed at Code Implementation of Object Detection using CNN.
Implementation of Standard HoughLine Transformation – cv2.HoughLines()
import math
import cv2 as cv2
import numpy as np

def main(filename):
    # Loads an image
    src = cv2.imread(cv2.samples.findFile(filename), cv2.IMREAD_GRAYSCALE)

    # detect edges using canny edge, for more details you can refer https://indiantechwarrior.com/canny-edge-detection-for-image-processing/
    dst = cv2.Canny(src, 50, 200, None, 3)

    # Copy edges to the images that will display the results in BGR
    dstp = cv2.cvtColor(dst, cv2.COLOR_GRAY2BGR)

    # Lets apply Standard HoughLine transform to detect lines
    lines = cv2.HoughLines(dst, 1, np.pi / 180, 150, None, 0, 0)

    # Below we will display the result by drawing lines
    if lines is not None:
        for i in range(0, len(lines)):
            rho = lines[i][0][0]
            theta = lines[i][0][1]
            a = math.cos(theta)
            b = math.sin(theta)
            x0 = a * rho
            y0 = b * rho
            pt1 = (int(x0 + 1000 * (-b)), int(y0 + 1000 * (a)))
            pt2 = (int(x0 - 1000 * (-b)), int(y0 - 1000 * (a)))
            cv2.line(dstp, pt1, pt2, (0, 0, 255), 3, cv2.LINE_AA)

    cv2.imshow("Source", src)
    cv2.imshow("Detected Lines (in red) - Standard Hough Line Transform", dstp)
    cv2.waitKey()
    return 0
Elaboration of function cv2.HoughLines()
cv2.HoughLines(dst, rho, theta, threshold, srn, stn)
dst: Input image should be a binary image, so apply threshold edge detection before finding applying hough transformrho : The resolution of the parameter r in pixels. We use 1 pixel
theta: The resolution of the parameter θ in radians. We use 1 degree (CV_PI/180)In an image analysis context, the coordinates of the point(s) of edge segments (i.e. X,Y ) in the image are known and therefore serve as constants in the parametric line equation, while R(rho) and Theta(θ) are the unknown variables we seek. If we plot the possible (r) values defined by each (theta), points in cartesian image space map to curves (i.e. sinusoids) in the polar Hough parameter space. This point-to-curve transformation is the Hough transformation for straight lines.
threshold : The minimum number of intersections to detect a line Threshold value means minimum vote it should get for it to be considered as a line. We need to remember here that number of votes depend upon number of points on the line. So it represents the minimum length of line that should be detected.
srn : For the multi-scale Hough transform, it is a divisor for the distance resolution rho. default 0stn: For the multi-scale Hough transform, it is a divisor for the distance resolution theta. default 0Transform is implemented by quantizing the Hough parameter space into finite intervals or accumulator cells. As the algorithm runs, each (X,Y) is transformed into a discretized (r,0) curve and the accumulator(2D array) cells which lie along this curve are incremented. Resulting peaks in the accumulator array represent strong evidence that a corresponding straight line exists in the image.
Implementation of Probabilistic HoughLine Transform – cv2.HoughLinesP()
import cv2 as cv2
import numpy as np

def main(filename):
    # Loads an image
    src = cv2.imread(cv2.samples.findFile(filename), cv2.IMREAD_GRAYSCALE)
    # detect edges using canny edge, for more details you can refer https://indiantechwarrior.com/canny-edge-detection-for-image-processing/
    dst = cv2.Canny(src, 50, 200, None, 3)
    # Copy edges to the images that will display the results in BGR
    cdst = cv2.cvtColor(dst, cv2.COLOR_GRAY2BGR)
    dstP = np.copy(cdst)
    # Lets apply Probabilistic Line Transform to detect lines

    linesP = cv2.HoughLinesP(dst, 1, np.pi / 180, 50, None, 50, 10)

    if linesP is not None:
        for i in range(0, len(linesP)):
            l = linesP[i][0]
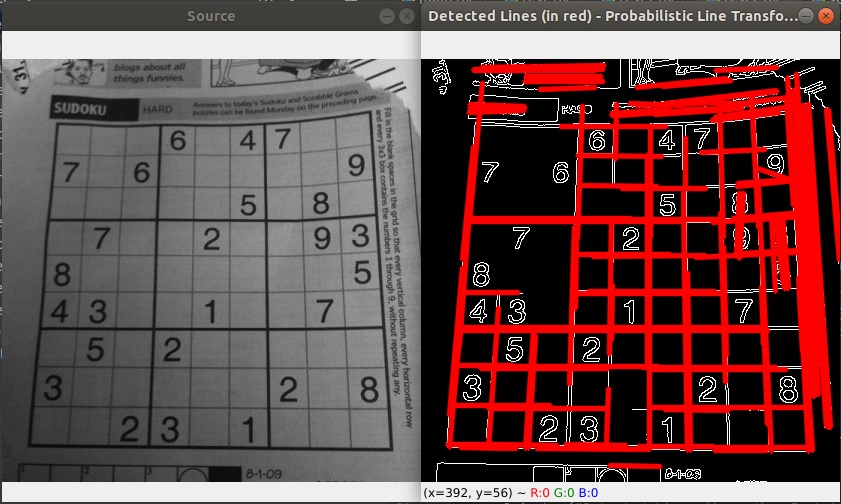
            cv2.line(dstP, (l[0], l[1]), (l[2], l[3]), (0, 0, 255), 3, cv2.LINE_AA)

    cv2.imshow("Source", src)
    cv2.imshow("Detected Lines (in red) - Probabilistic Line Transform", dstP)

    cv2.waitKey()
    return 0


if __name__ == "__main__":
    default_file = 'image.jpg'
    main(default_file)
Elaboration of function cv2.HoughLines P()
cv2.HoughLinesP(dst, rho, theta, threshold, minLineLength, maxLineGap)dst: Input image should be a binary image, so apply threshold edge detection before finding applying hough transformrho : The resolution of the parameter r in pixels. We use 1 pixel
theta: The resolution of the parameter θ in radians. We use 1 degree (CV_PI/180)In an image analysis context, the coordinates of the point(s) of edge segments (i.e. X,Y ) in the image are known and therefore serve as constants in the parametric line equation, while R(rho) and Theta(θ) are the unknown variables we seek. If we plot the possible (r) values defined by each (theta), points in cartesian image space map to curves (i.e. sinusoids) in the polar Hough parameter space. This point-to-curve transformation is the Hough transformation for straight lines.
threshold : The minimum number of intersections to detect a line Threshold value means minimum vote it should get for it to be considered as a line. We need to remember here that number of votes depend upon number of points on the line. So it represents the minimum length of line that should be detected
minLineLength: The minimum number of points that can form a line. Lines with less than this number of points are disregardedmaxLineGap: The maximum gap between two points to be considered in the same lineIn general, its suggested to use Probabilistic HoughLine Transform – cv2.HoughLinesP() for lines identification.


